 |
Главная Случайная страница Контакты | Мы поможем в написании вашей работы! | |
A. Match pictures 1-4 to a)-d)
|
|
1 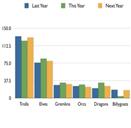 2
2  3
3 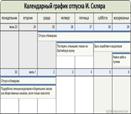 4
4 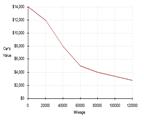
| a) pie chart | b) bar chart | c) graph | d) table |
B. Graphs, charts and d  iagrams give a clear picture of trading performance and other statistical information. Study the statistics vocabulary.
to stand at Sales stand at 5 units.
to remain constant Sales remained constant.
to reach a peak of Sales reached a pick of 5 units. |  
  5 5
 2 2
 to increase an increase of
to rise by/to a rise of
to go up
to grow
Chocolate price increased by £3.
Chocolate price increased to £5.
There was a price rise of £2. to increase an increase of
to rise by/to a rise of
to go up
to grow
Chocolate price increased by £3.
Chocolate price increased to £5.
There was a price rise of £2.
 2
2
 to decrease a decrease of
to fall a fall of
to drop by/to a drop of
to decline a decline of
to go down
Sales decreased to2 units last year. to decrease a decrease of
to fall a fall of
to drop by/to a drop of
to decline a decline of
to go down
Sales decreased to2 units last year.
| |||||||||
    3
to level off at
Sales levelled off at 3 units. 3
to level off at
Sales levelled off at 3 units.
|
    to fluctuate
Sales fluctuated for one year.
to fluctuate
Sales fluctuated for one year.
| |||||||||
| You may use the following adverbs and adjectives with the above verbs and nouns | ||||||||||
| sharply/dramatically – резко rapidly – быстро slightly – слегка, немного gradually – постепенно steadily – стабильно Prices increased sharply last year. Sales declined rapidly during May. | sharp/dramatic rapid steady There was a sharp increase in sales. There was a rapid decline in May. | |||||||||


Дата публикования: 2014-10-25; Прочитано: 480 | Нарушение авторского права страницы | Мы поможем в написании вашей работы!
