 |
Главная Случайная страница Контакты | Мы поможем в написании вашей работы! | |
A. Match pictures 1-4 to a)-d)
|
|
1 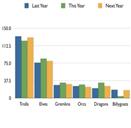 2
2 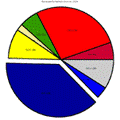 3
3 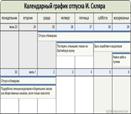 4
4 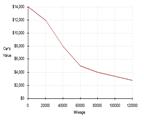
| a) pie chart | b) bar chart | c) graph | d) table |
B. Graphs, charts and d  iagrams give a clear picture of trading performance and other statistical information. Study the statistics vocabulary.
to stand at Sales stand at 5 units.
to remain constant Sales remained constant.
to reach a peak of Sales reached a pick of 5 units. Дата публикования: 2014-10-25; Прочитано: 422 | Нарушение авторского права страницы | Мы поможем в написании вашей работы!  |


 5
5 